| H2-PV | SOLAR MAPS, USA |
SOLAR MAPS, USA, ANNUAL AVERAGE and MONTHLY AVERAGES
 |
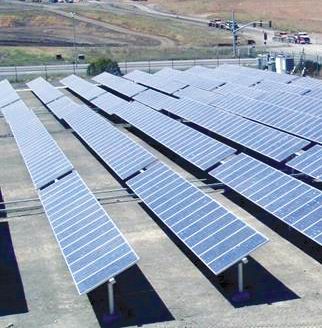
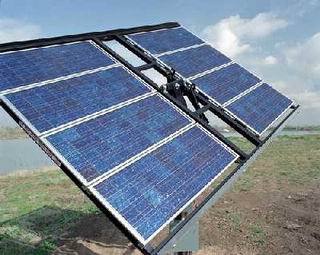
Flat, Tilted toward Sun, Fixed Position
|
 |
 |
 |
 |
 |
 |
 |
 |
 |
 |
 |
 |
http://www.nrel.gov/gis/solar.html
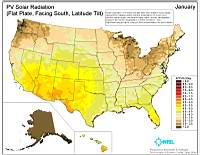
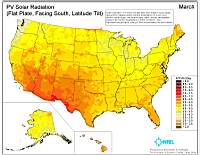
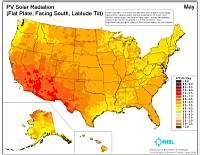
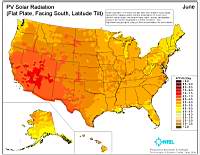
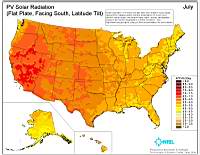
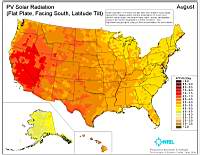
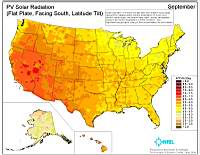
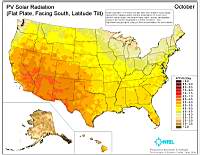
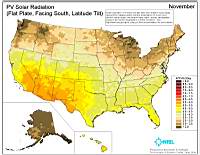
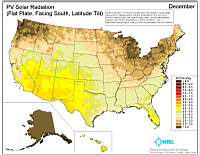
PV Solar Radiation (Flat Plate, Facing South, Latitude Tilt)—Static Maps
(.jpeg images ranging in size from 260-273kb)
These maps provide monthly average daily total solar resource information on grid cells of approximately 40 km by 40 km in size. The insolation values represent the resource available to a flat plate collector, such as a photovoltaic panel, oriented due south at an angle from horizontal to equal to the latitude of the collector location. If you have difficulty accessing these maps because of a disability, please contact the Webmaster. Learn more about Solar Resources for Flat Plate Collectors.
* Annual (JPG 263 KB) http://www.nrel.gov/gis/images/us_pv_annual_may2004.jpg
* January (JPG 256 KB) http://www.nrel.gov/gis/images/us_pv_january_may2004.jpg
* February (JPG 267 KB) http://www.nrel.gov/gis/images/us_pv_february_may2004.jpg
* March (JPG 272 KB) http://www.nrel.gov/gis/images/us_pv_march_may2004.jpg
* April (JPG 270 KB) http://www.nrel.gov/gis/images/us_pv_april_may2004.jpg
* May (JPG 267 KB) http://www.nrel.gov/gis/images/us_pv_may_may2004.jpg
* June (JPG 261 KB) http://www.nrel.gov/gis/images/us_pv_june_may2004.jpg
* July (JPG 267 KB) http://www.nrel.gov/gis/images/us_pv_july_may2004.jpg
* August (JPG 269 KB) http://www.nrel.gov/gis/images/us_pv_august_may2004.jpg
* September (JPG 273 KB) http://www.nrel.gov/gis/images/us_pv_september_may2004.jpg
* October (JPG 268 KB) http://www.nrel.gov/gis/images/us_pv_october_may2004.jpg
* November (JPG 262 KB) http://www.nrel.gov/gis/images/us_pv_november_may2004.jpg
* December (JPG 260 KB) http://www.nrel.gov/gis/images/us_pv_december_may2004.jpg
 |
Motorized, Tilts Up & Down, Swivels Side-to-Side, Always faces sun directly.
|
 |
 |
 |
 |
 |
 |
 |
 |
 |
 G G |
 |
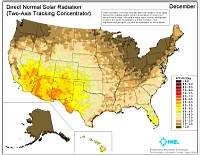 |
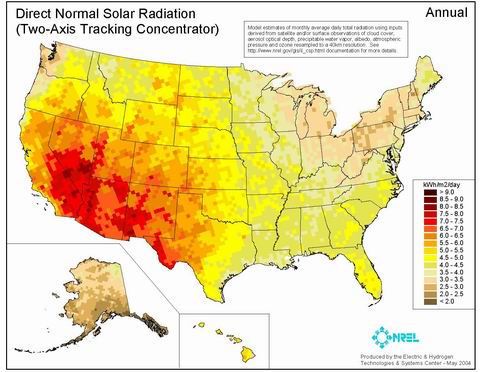
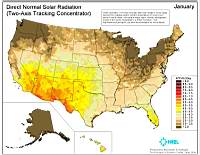
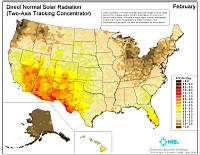
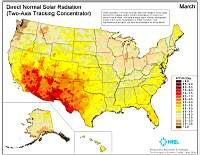
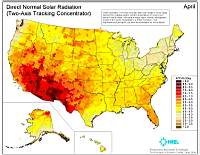
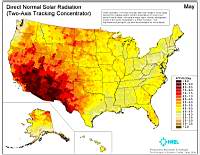
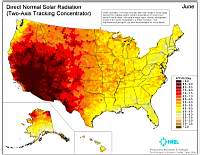
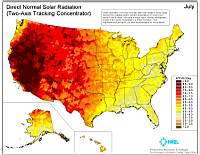
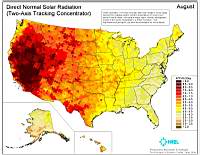
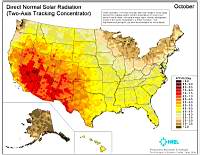
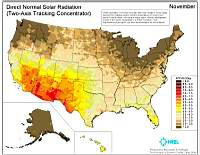
Direct Normal Solar Radiation (Two-Axis Tracking Concentrator)—Static Maps
(.jpeg images ranging in size from 268-299kb)
These maps provide monthly average daily total solar resource
information on grid cells of approximately 40 km by 40 km in size. The
insolation values represent the resource available to concentrating
systems that track the sun throughout the day. If you have difficulty
accessing these maps because of a disability, please contact the
Webmaster.
* Annual (JPG 287 KB) http://www.nrel.gov/gis/images/us_csp_annual_may2004.jpg
* January (JPG 268 KB) http://www.nrel.gov/gis/images/us_csp_january_may2004.jpg
* February (JPG 278 KB) http://www.nrel.gov/gis/images/us_csp_february_may2004.jpg
* March (JPG 286 KB) http://www.nrel.gov/gis/images/us_csp_march_may2004.jpg
* April (JPG 296 KB) http://www.nrel.gov/gis/images/us_csp_april_may2004.jpg
* May (JPG 294 KB) http://www.nrel.gov/gis/images/us_csp_may_may2004.jpg
* June (JPG 290 KB) http://www.nrel.gov/gis/images/us_csp_june_may2004.jpg
* July (JPG 294 KB) http://www.nrel.gov/gis/images/us_csp_july_may2004.jpg
* August (JPG 299 KB) http://www.nrel.gov/gis/images/us_csp_august_may2004.jpg
* September (JPG 296 KB) http://www.nrel.gov/gis/images/us_csp_september_may2004.jpg
* October (JPG 291 KB) http://www.nrel.gov/gis/images/us_csp_october_may2004.jpg
* November (JPG 272 KB) http://www.nrel.gov/gis/images/us_csp_november_may2004.jpg
* December (JPG 270 KB) http://www.nrel.gov/gis/images/us_csp_december_may2004.jpg
| H2-PV Breeders | H2-PV HOME PAGE | USA Solar Energy Maps |
| Basic Hydrogen Facts | Energy Equivilence Table | Electromagnetic Casting (EMC) |
| Hydrogen Motor Fuels | Hydrogen Storage | Hydrogen Safety |
| Hydrogen Electrolysis | PV Technologies | Silicon Purification |
| Fuel Cell Technologies | Palaces for the People | Business Plan |
This page webaddress is http://H2-PV.US/PV/Solar_Maps.html